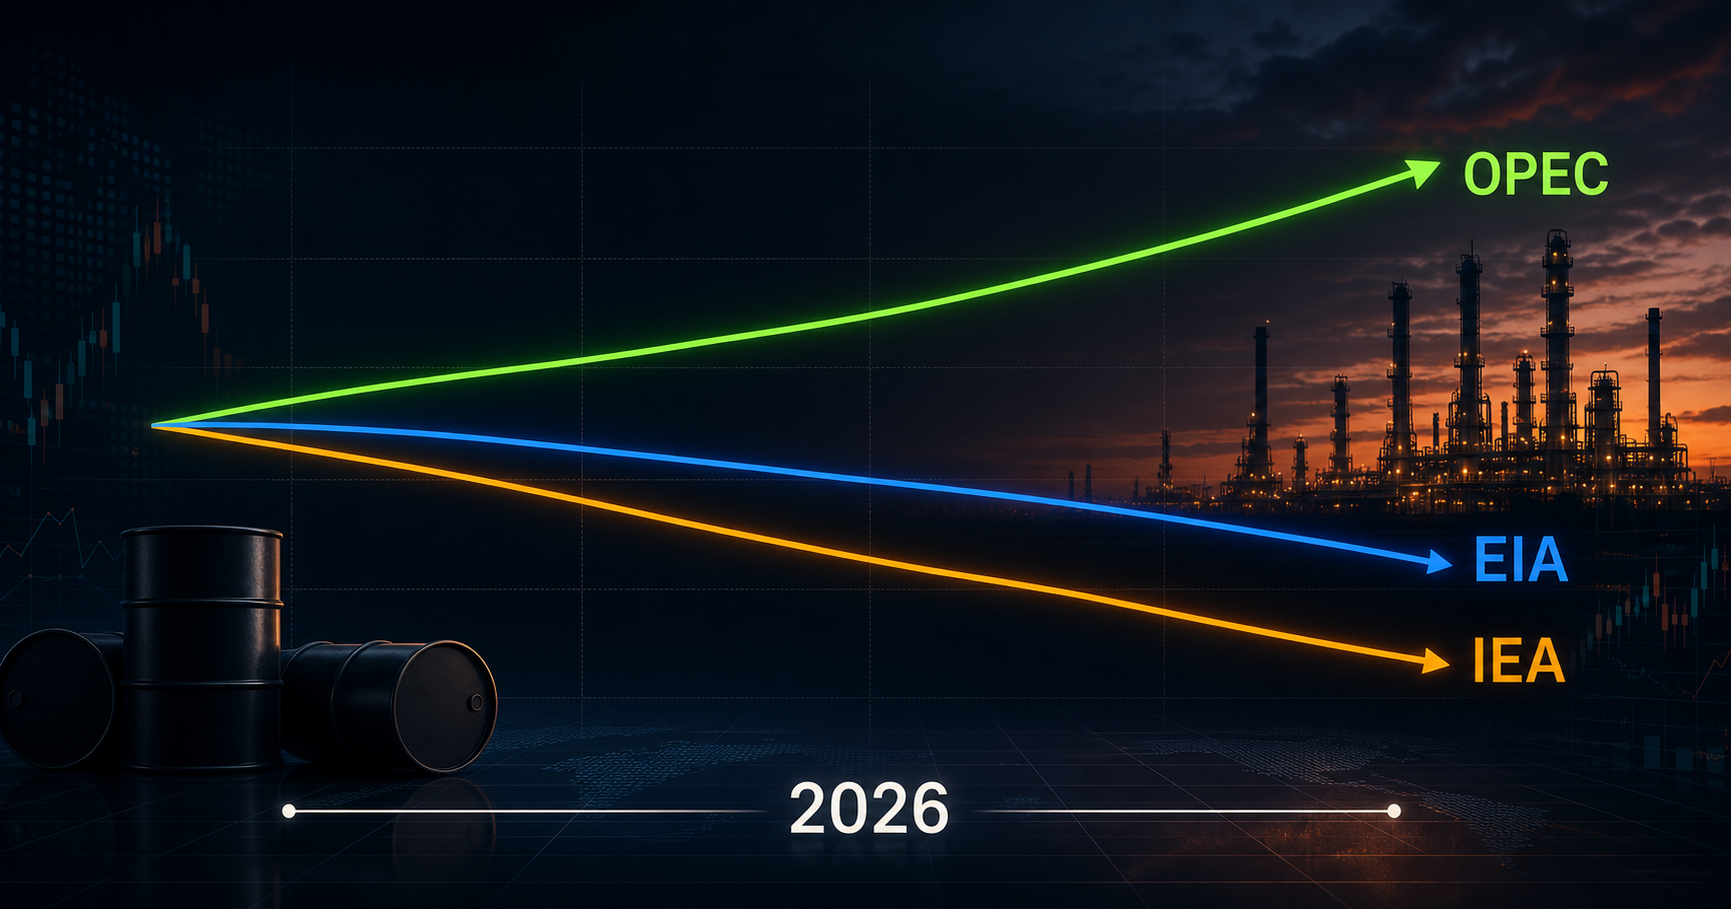
Oil Demand Forecast Divergence 2026
EIA and IEA now forecast a 2026 oil demand decline while OPEC still sees growth. The gap changes how traders should read prices, inventories, refining margins, and the 2027 rebound setup.
Last updated: June 30, 2026. Sources named in the article: [EIA Short-Term Energy Outlook; June 2026](https://www.eia.gov/outlooks/steo/); [EIA Refinery Capacity Report; June 2026](https://www.eia.gov/petroleum/refinerycapacity/); [IEA Oil Market Report; June 2026](https://www.iea.org/reports/oil-market-report-june-2026); [OPEC Monthly Oil Market Report; June 2026](https://publications.opec.org/momr). PetroEyes analysis uses these public forecasts as source material and does not provide personalized investment advice.. To report an error, write to hello@petroeyes.com and see our editorial policy.
Oil Demand Forecast Divergence 2026: EIA, IEA, and OPEC Split
The Short Answer
Short Answer: The 2026 oil market now has a rare forecasting split: EIA and IEA both expect global oil demand to fall by about 1.1 million barrels per day in 2026, while OPEC still expects demand to grow by about 1.0 million barrels per day. The difference is not academic. It decides whether tight inventories are a temporary shock or the start of a higher-price demand reset.
That spread between forecasts is the best oil-market signal to watch at the end of June 2026. Price charts alone are noisy because the market is digesting shipping disruptions, emergency stock releases, refinery cuts, and the possible reopening of Strait of Hormuz traffic. Forecast dispersion cuts through some of that noise.
When forecasters disagree by roughly two million barrels per day, the practical question is not "who is right?" The better question is: what evidence would prove one side wrong first?
Why The Forecasts Split So Hard
The June 2026 EIA Short-Term Energy Outlook says high fuel prices, reduced availability, and government initiatives lowered oil demand enough for the agency to forecast a 1.1 million b/d decline in global consumption this year. That is a sharp reversal from the EIA's February 2026 view, which expected a 1.2 million b/d increase. EIA also expects demand to rebound by 2.5 million b/d in 2027 as flows normalize and prices ease. Source: EIA Short-Term Energy Outlook, June 9, 2026.
The IEA's June 2026 Oil Market Report lands in a similar place on 2026 demand. It forecasts global oil demand down 1.1 million b/d year over year, with second-quarter deliveries down 5 million b/d as price spikes and product shortages hit end users. It also expects 2027 demand to recover by about 2 million b/d. Source: IEA Oil Market Report, June 2026.
OPEC's June 2026 Monthly Oil Market Report is still more constructive. Its digital publication shows global oil demand growth of about 1.0 million b/d in 2026, with non-OECD demand doing most of the work. Source: OPEC Monthly Oil Market Report, June 2026.
| Forecaster | 2026 Global Demand View | 2027 View | What It Emphasizes |
|---|---|---|---|
| EIA | -1.1 million b/d | +2.5 million b/d | Supply disruption, high prices, product availability, recovery after flows normalize |
| IEA | -1.1 million b/d | +2.0 million b/d | End-user demand hit, lower refinery runs, stock draws, eventual overhang risk |
| OPEC | +1.0 million b/d | +1.7 million b/d | Non-OECD growth, transport fuels, petrochemical feedstocks, emerging-market resilience |
This is not just a difference in tone. It is a difference in mechanism. EIA and IEA are treating the 2026 shock as a demand event as well as a supply event. OPEC is treating it as a growth market that is temporarily distorted by logistics and pricing stress.
The Three Tests That Decide Which Forecast Wins
1. Product Demand Has To Reappear Before Crude Demand Can Recover
Oil demand is not a single number in the physical market. Drivers buy gasoline. Airlines buy jet fuel. Trucking fleets buy diesel. Chemical plants buy naphtha and LPG. Refineries translate those product markets back into crude runs.
That means the first test is product demand, not headline crude prices.
If EIA and IEA are right, the 2026 demand decline should show up in:
- weaker gasoline supplied data during the driving season;
- lower diesel and jet fuel deliveries even after prices retreat;
- refinery run cuts in Asia and the Middle East;
- product cracks that stay volatile because supply is tight but end-user volumes are soft.
If OPEC is right, product demand should normalize quickly once availability improves. In that scenario, lower prices would pull back postponed consumption, refinery runs would rise, and Asian import demand would recover before fourth-quarter balances are settled.
PetroEyes will treat U.S. product supplied, China crude imports, India refinery throughput, and OECD stock changes as the near-term proof set. Those measures update faster than annual forecasts and are harder to explain away.
2. Inventory Draws Need To Be Separated From Healthy Demand
Large inventory draws can look bullish. But in 2026, they need careful reading.
The IEA says observed global oil stocks have been falling at a record pace since the Gulf conflict began, while EIA expects OECD inventories to fall to their lowest levels since 2003. That is a tight-market signal. But it does not automatically prove demand strength. Inventories can fall because supply is disrupted, emergency reserves are being released, and product logistics are broken.
Here is the useful distinction:
| Inventory Signal | Bullish Demand Interpretation | Demand-Destruction Interpretation |
|---|---|---|
| Crude stocks falling | Refineries need more crude | Supply is short and refiners are drawing tanks |
| Product stocks falling | Consumers are buying more fuel | Refinery outages and logistics are limiting supply |
| SPR or government stocks falling | Policy support is bridging a temporary shock | Emergency releases are hiding weaker private demand |
| Stocks rebuild after flows normalize | Demand cooled enough to restore buffers | Supply recovery is outrunning consumption |
That last row is the key. If inventories rebuild fast while Brent falls, EIA and IEA will look right. If inventories keep drawing even after Strait of Hormuz flows normalize, OPEC's demand-growth view gains credibility.
For background on how PetroEyes reads inventory pressure, see our SPR release impact analysis.
3. Petrochemical Demand Has To Carry More Weight Than Mobility Loss
OPEC's demand case leans heavily on non-OECD growth and petrochemical feedstocks. That argument is not weak. Petrochemical demand is harder to electrify than passenger transport, and non-OECD economies still have lower per-capita fuel consumption than the OECD.
But the argument needs proof in 2026 because mobility is now the soft spot.
Passenger transport is being squeezed by high fuel prices, weaker disposable income, hybrid work, and EV adoption. Diesel is exposed to slower freight and industrial activity. Jet fuel can rebound quickly, but it is also sensitive to fares and regional disruption.
The question is whether naphtha, LPG, and petrochemical feedstock demand can offset those losses. If petrochemicals hold up while gasoline and diesel fade, OPEC can still be directionally right about the long-term barrel mix while being too optimistic about 2026 total demand.
That is why the best comparison is not "oil demand up or down." It is:
- transportation fuels versus petrochemical feedstocks;
- OECD weakness versus non-OECD resilience;
- refinery runs versus end-user deliveries;
- crude imports versus product consumption.
The petrochemical pivot is a structural trend. The new wrinkle is that the June shock has turned it into a short-term forecasting fight.
A Trader's Decision Matrix For The Next 90 Days
The next 90 days should be read as a proof window. Forecasts will move, but the data sequence matters more than the headline revisions.
| If You See This | It Supports | Market Meaning |
|---|---|---|
| Brent falls while product demand stays weak | EIA/IEA | Demand destruction is real, price risk shifts lower after supply returns |
| Brent falls but product demand rebounds quickly | OPEC | The demand hit was temporary, inventory rebuild may be slower than expected |
| Refinery runs recover before imports recover | Mixed | Plants are using inventories first, crude demand signal is delayed |
| Asian imports rebound but product stocks rise | Bearish | Crude buying is rebuilding buffers, not serving stronger end demand |
| Diesel and jet fuel cracks stay firm | Bullish products | Refining bottlenecks may matter more than crude supply |
The cleanest bullish signal would be a synchronized recovery in Asian imports, refinery runs, product deliveries, and stable product cracks. The cleanest bearish signal would be the opposite: imports recover, prices fall, but product demand stays soft and stocks rebuild.
June 30 Refinery Capacity Check: The Bottleneck Test
EIA's annual Refinery Capacity Report was released on June 26, 2026, with plant-level and PAD District data as of January 1, 2026. It matters for this forecast fight because refinery capacity is the bridge between crude supply and the fuel consumers actually buy. Source: EIA Refinery Capacity Report, June 26, 2026.
The report covers operable crude distillation capacity, downstream charge capacity, refinery receipts by transportation mode, fuel consumed at refineries, sales, shutdowns, and individual refinery capacity. PetroEyes is using it as a structural baseline for Q3 checks, not as a weekly demand signal.
Here is the practical read:
| Refinery Signal | If Capacity Is The Constraint | If Demand Is The Constraint |
|---|---|---|
| Crude runs | High utilization even when prices are painful | Run cuts despite available crude |
| Product stocks | Low because refineries cannot rebuild supply fast enough | Rising because end users are buying less |
| Diesel and jet fuel cracks | Stronger than crude because product supply is scarce | Weakening once disrupted trade routes normalize |
| Gulf Coast exports | Elevated because global buyers need U.S. product | Normalizing quickly as foreign refiners restart |
This is the bottleneck test for July and August. If refinery utilization and product exports stay firm while product supplied weakens, the market is split between scarce refined barrels and soft end-user demand. If utilization fades at the same time products rebuild, the EIA/IEA demand-destruction view gets stronger.
The June capacity baseline also keeps the analysis from confusing a refinery problem with a crude problem. A market can have enough crude on paper and still have tight diesel or jet fuel if the right upgrading, hydrotreating, or logistics capacity is missing in the right region.
What This Means For Oil Price Forecasts
This forecast split changes how to read the Brent price band.
If the EIA/IEA demand-decline view is right, then a high Brent price is a temporary stress price. It reflects supply disruption and depleted buffers more than durable consumption strength. Under that path, the market can remain tight in the summer, then soften hard once barrels and refined products start moving normally.
If OPEC's growth view is right, then the summer disruption has hidden a stronger underlying demand floor. Prices could fall from panic levels and still stay elevated because non-OECD demand absorbs returning barrels faster than bears expect.
That is why PetroEyes is watching the $79 to $82 Brent zone differently from the $100-plus panic zone. Above $100, the market is trading logistics stress. Around $80, it starts trading whether demand is actually damaged.
For a related price framework, see the WTI vs Brent spread analysis. For household exposure to fuel-price shocks, EnergyBS has a practical breakdown of what a furnace replacement costs in 2026, which is the decision many oil- and gas-heated households face when fuel bills spike.
The Information-Gain Angle Competitors Are Missing
Most daily oil notes frame this as "OPEC bullish, IEA bearish." That is too shallow. The useful question is whether the same barrel is being counted as demand in three different ways:
- Physical delivery demand: fuel actually delivered to end users.
- Refinery intake demand: crude processed because refineries need products or want margins.
- Inventory rebuilding demand: crude bought to refill depleted tanks.
Those three can move together in a healthy market. In 2026, they may move separately. A country can import more crude to rebuild stocks while drivers and factories are still consuming less fuel. If analysts treat all three as the same kind of demand, they will overstate the recovery.
This is the distinction PetroEyes will track through Q3 and Q4.
Frequently Asked Questions
Why do EIA, IEA, and OPEC disagree on 2026 oil demand?
They use different assumptions about price response, supply recovery, product availability, and non-OECD growth. EIA and IEA now treat the 2026 shock as severe enough to reduce demand. OPEC still expects emerging-market and petrochemical demand to keep global consumption growing.
Is falling oil demand bearish for energy stocks?
Not automatically. Falling demand can pressure upstream producers, but tight refined-product markets can still support refiners and some midstream assets. The stock impact depends on whether the weakness appears in crude prices, product margins, export volumes, or all three at once. This is not investment advice.
What data should traders watch first?
Watch weekly product supplied, refinery runs, OECD inventories, China and India import data, and product crack spreads. These indicators will confirm whether lower demand is temporary shock behavior or a more durable consumption reset.
Can petrochemicals offset lower gasoline demand?
Partly, but not always enough. Petrochemical feedstocks such as naphtha and LPG are structurally important, especially in non-OECD markets. But a sharp decline in gasoline, diesel, and jet fuel can still overwhelm petrochemical growth during a price shock.
What is the biggest risk to the bearish demand case?
The biggest risk is a fast normalization of trade flows plus a quick rebound in Asian refinery runs. If that happens while inventories remain low, demand may prove more resilient than EIA and IEA currently forecast.
What to Read Next
Next up: Global Oil Supply Deficit 2026 Explained - how the supply side of the same balance sheet is moving.